Getting Started

Once you have downloaded the scripts and added the sleepsmg folder to your path in Matlab, you can start the program by typing:
>> sleepSMG
Once you start up the program you will see this box in the upper left corner of the program:

EEG filename

This is the name of the file that contains your eeg data. This file can come in 3 different formats:

  • .mat - This should be a saved copy of an EEGlab data struct. To make this file, open your data in EEGlab and then use save('myEEGdata.mat', 'EEG') to save the resulting struct.
  • .edf - (requires EEGlab to be open) When you use this option it will automatically load your data using EEGlab.
  • .set - (requires EEGlab to be open) When you use this option it will automatically load your data using EEGlab.

When sleeepSMG loads the data it will expect that the EEG.chanlocs contains labels for all of the channels used in your montage. The default montage (sleep_Montage) requires these channels: ROC, LOC, C3, O2, C4, O1, EMG1, EMG2, EMG3. The order of the channels does no matter, only the labels. Click here for more about montages and how to set up your own montage.

Stage filename

This is the name of the .mat file that will contain all of your stage information. If you want to start a new set of scores, just type in whatever filename you want to use. If you want to review data that you previously scored or continue scoring, you can enter that file instead.

After scoring, if you load this file in matlab you will find a struct called stageData that will contain all of the information you entered using sleepSMG. Click here for more details about stageData output.

Notes

You are not required to enter a notes file. However, if you select a type of notes file from this drop down menu, you can enter a file that contains notes recorded during the sleep recording (i.e. things like the time of lights on and lights off or information from your bio-calibrations). Currently the only working notes format is from Twin recordings. Click here for more information about how to read in note files.

Load

After you press load another box will appear so that you can enter in critical landmarks for your sleep data:

If this is the first time you have scored this data using this stage file, you will need to enter in the times for the record start, lights off and lights on using the hhmmss.fff format. This information will be saved so that if you load the stage file later it will be filled in.

Window Size

The window size is the number of seconds that you want to show in each "window" to be scored. In other words it is the length of time (in seconds) in each epoch.

Start Scoring

Once you start up the program it will look like this:

To start scoring you can either use the buttons in the upper right of the panel or you can use the key board shortcuts. To use the keyboard, you must first click somewhere on the window that is not on a figure object. Clicking just to the left of the channel label axis works well. Here are the shortcuts:

  • 0 - Stage Wake
  • 1 - Stage 1
  • 2 - Stage 2
  • 3 - Stage 3
  • 4 - Stage 4
  • 5 - Stage REM
  • 6 - Movement Time
  • . - Mark epoch as unscored
  • 7 - Scroll an epoch to the left
  • 9 - Scroll an epoch to the right

Menu Items

Start

  • New Dataset - this will bring up the boxes described in "Getting Started". However, it's probably best to close the program between subjects.
  • Compare Scores - these options are for comparing scores across individual scores or for showing online feedback from another persons scores while you are learning how to score.

Channels

  • Hide a Channel - This will bring up a dialog box so that you can type in a channel by name and hide that channel (be sure to use the exact same names that show up on the axis labels).
  • Show a Channel - This will bring up a dialog box so that you can type in a channel by name and show that channel (be sure to use the exact same names that show up on the axis labels).
  • Set scale lines - This will either add or remove the red scale indication lines from the channel that you type in. The default is for the scale lines to be on channel C3. The placement of the lines is defined in the montage that you are using. The default "sleep_Montage" has a dotted line at 25 microvolts and a solid line at 50 microvolts.

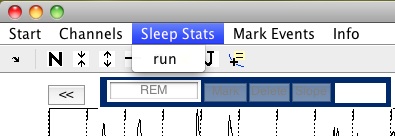
Sleep Stats

  • run - Use this to run the sleep statistics script "plotSleepStats" on your current stage data.

Mark Events

  • Marking on/off - Used to turn marking mode on or off. Note: the keyboard shortcuts will not work when the marking mode is on. You will have to use the buttons to scroll and mark stages.
  • Clear All Events - You can type in a name of an event and all of the events that you have marked with that name will be deleted.

Info

  • Author Info - Information about the program authors.
  • Hot Keys - Reminders about what the keyboard shortcuts are for scoring.

Start Scoring

Once you start up the program it will look like this:

To start scoring you can either use the buttons in the upper right of the panel or you can use the key board shortcuts. To use the keyboard, you must first click somewhere on the window that is not on a figure object. Clicking just to the left of the channel label axis works well. Here are the shortcuts:

  • 0 - Stage Wake
  • 1 - Stage 1
  • 2 - Stage 2
  • 3 - Stage 3
  • 4 - Stage 4
  • 5 - Stage REM
  • 6 - Movement Time
  • . - Mark epoch as unscored
  • 7 - Scroll an epoch to the left
  • 9 - Scroll an epoch to the right

Montages

The montage is the configuration script that is used to set up what channels are displayed and how they look. All of the montage scripts are stored in the folder YOURPATH/sleepsmg/montages and each montage file ends with "_Montage.m". Any file that is in this folder with this suffix will be automatically added to the montage list when you start up sleepSMG shown here:

Making a montage

All montage scripts must have no outputs and must take handles and range as inputs for example the function header must look like this:
function sleep_Montage(handles, range)

  • handles is a struct that contains all the handles to the figure elements of the interface as well as the EEG data and all of the staging data for the program.
  • range is the current range (in data points) that you want to be ploted on the main axes of the program.
The purpose of the montage is to plot the EEG data in the main axis of the figure.

Example montage script

Click here to browse the example montage script. You can also find the source code for this script in the sleepsmg folder.

If all you want to do is change the electrodes you want to show or the colors of the electrodes then just make a copy of the sleep_Montage script and edit the electrodes list and colors list at the top of the file under the setup section.

Output Data

The output is saved in the file that you specify in the "stage filename" box when you start the program. If you load this file into matlab (e.g. load(stageFile.mat)) you will get a struct called stageData with the following information:

  • Notes: This is a string containing whatever you may have written in the notes box.
  • win: The window size (i.e. epoch length in seconds) that you scored the data in.
  • srate: The sampling rate of your data.
  • lightsON: A datenum containing the time of lights on. To see the time use datestr(stageData.lightsON).
  • lightsOFF: A datenum containing the time of lights off.
  • recStart: A datenum containing the time of the record start.
  • stages: A vector of stages with one for every epoch of your data.
  • stageTime: A vector of times (in minutes) of the start of each epoch.
  • onsets: A vector of times (in data points) of the start of each epoch.

The stageData.stages vector uses the following codes:

  • 0 - Stage Wake
  • 1 - Stage 1
  • 2 - Stage 2
  • 3 - Stage 3
  • 4 - Stage 4
  • 5 - Stage REM
  • 6 - Movement Time
  • 7 - Unscored - Note: you should always have a string of 7's at the beginning and end of your data but you should have no 7's in between lights on an lights off.