Sleep Statistics
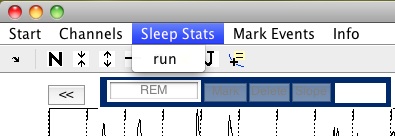
Once you have scored the record, you can then run the sleep statistics for that record. You can either run the sleep stats from the matlab command line described below or you can use the menu option "Sleep Stats->run".

- stageStats.html - a web page summary of your statistics results. Click here for an example.
- stageStats_hyp1.jpg - a plot of the hypnogram colored by NREM-REM cycle used in the web page summary.
- stageStats_hyp2.jpg - a plot of the hypnogram with slow wave sleep collapsed, colored by NREM-REM cycle used in the web page summary.
- stageStats_SPdist.jpg - a plot of the sleep percentage distribution of all the stages.
- stageStats_stats.mat - a file containing a struct of all the statistics output.
stageStats
When you load stageStats_stats.mat you will get a struct called stageStats. This struct contains all of the statistics data in the following fields:
- lightsOUT - A string containing the time of lights out.
- lightsON - A string containing the time of lights on.
- milestones - A matrix containing the following rows:
- The sleep onset epoch relative to lights off (column 1) and the record start (column 2)
- The epoch of final awakening relative to lights off (column 1) and the record start (column 2)
- The first scored epoch relative to the record start (column 1 only)
- lastStageSleep - The name of the last stage of sleep.
- awakeLightsOn - Indicates if the subject was awake at lights on.
- percentSleep - The entire sleep percentages table. Refer to the web output to see how this table is organized.
- SleepLat - The entire sleep latency table in epochs (column one) and minutes (column two). Refer to the web output to see how this table is organized.
- split4 - The "Quarters" table that shows the percentage of all the sleep stages in each quarter of the sleep period time (SPT).
- quarterBounds - The time (in epochs) of the start and end of each quarter relative to lights off.
- split3 - The "Thirds" table that shows the percentage of all the sleep stages in each third of the sleep period time (SPT).
- thirdBounds - The time (in epochs) of the start and end of each third relative to lights off.
- cycleBounds - The time (in epochs) of the start and end of each NREM-REM cycle relative to lights off.
- NREMsegs - a cell array where each entry contains the start and end (in epochs) of each NREM segment.
- REMsegs - a cell array where each entry contains the start and end (in epochs) of each NREM segment.
- CycleStats - The "NREM-REM Cycle Stats" table that shows the percentage of all the sleep stages in each NREM-REM cycle. Refer to the web output to see how this table is organized.
- NREMperiodStats - The "NREM Period Stats" table that shows the percentage of all the sleep stages in each NREM period.
- REMperiodStats - The "REM Period Stats" table that shows the percentage of all the sleep stages in each REM period.
- CycleSummary - a vector containing the following entries:
- The number of NREM-REM cycles
- The number of REM periods
- The mean number of segments per REM period
- The standard deviation of REM segments per REM period
- REMtoLsleep - The time (in minutes) between the last REM epoch and the last sleep epoch.
- REMtoLon - The time (in minutes) between the last REM epoch and lights on.
- transTableAll - The entire transition table. (This tells you how many times the subject's sleep transitioned from each stage to each other stage.)
- transTableCollapse - The transition table with slow wave sleep collapsed across stage 3 and 4.